GEM Programming Solutions
Data Visualisations
Below is a small selection of typical data visualisations, both static and dynamic, that GEM Programming routinely deliver to our customers. We can utilise your corporate colour scheme to make your PowerPoint slides look more professional
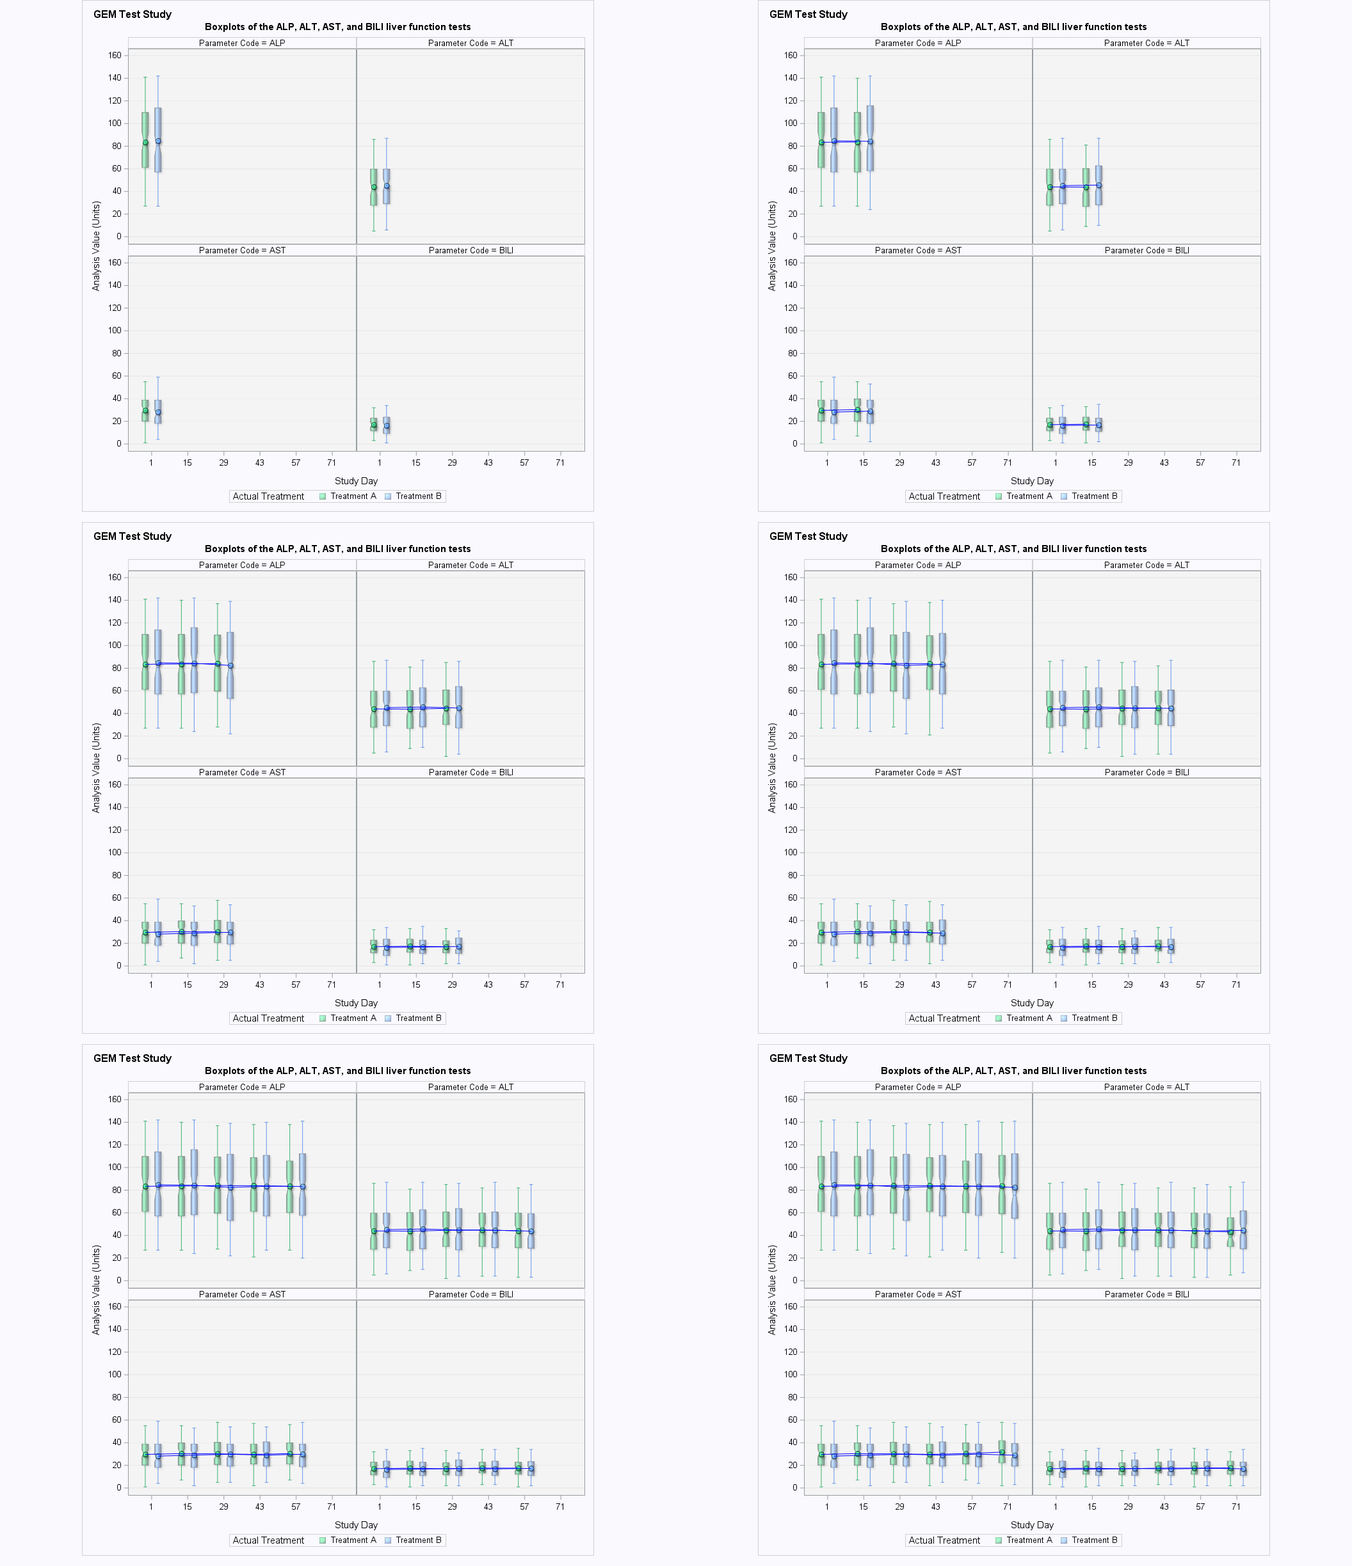
Box Plot Panels
View Animated Example
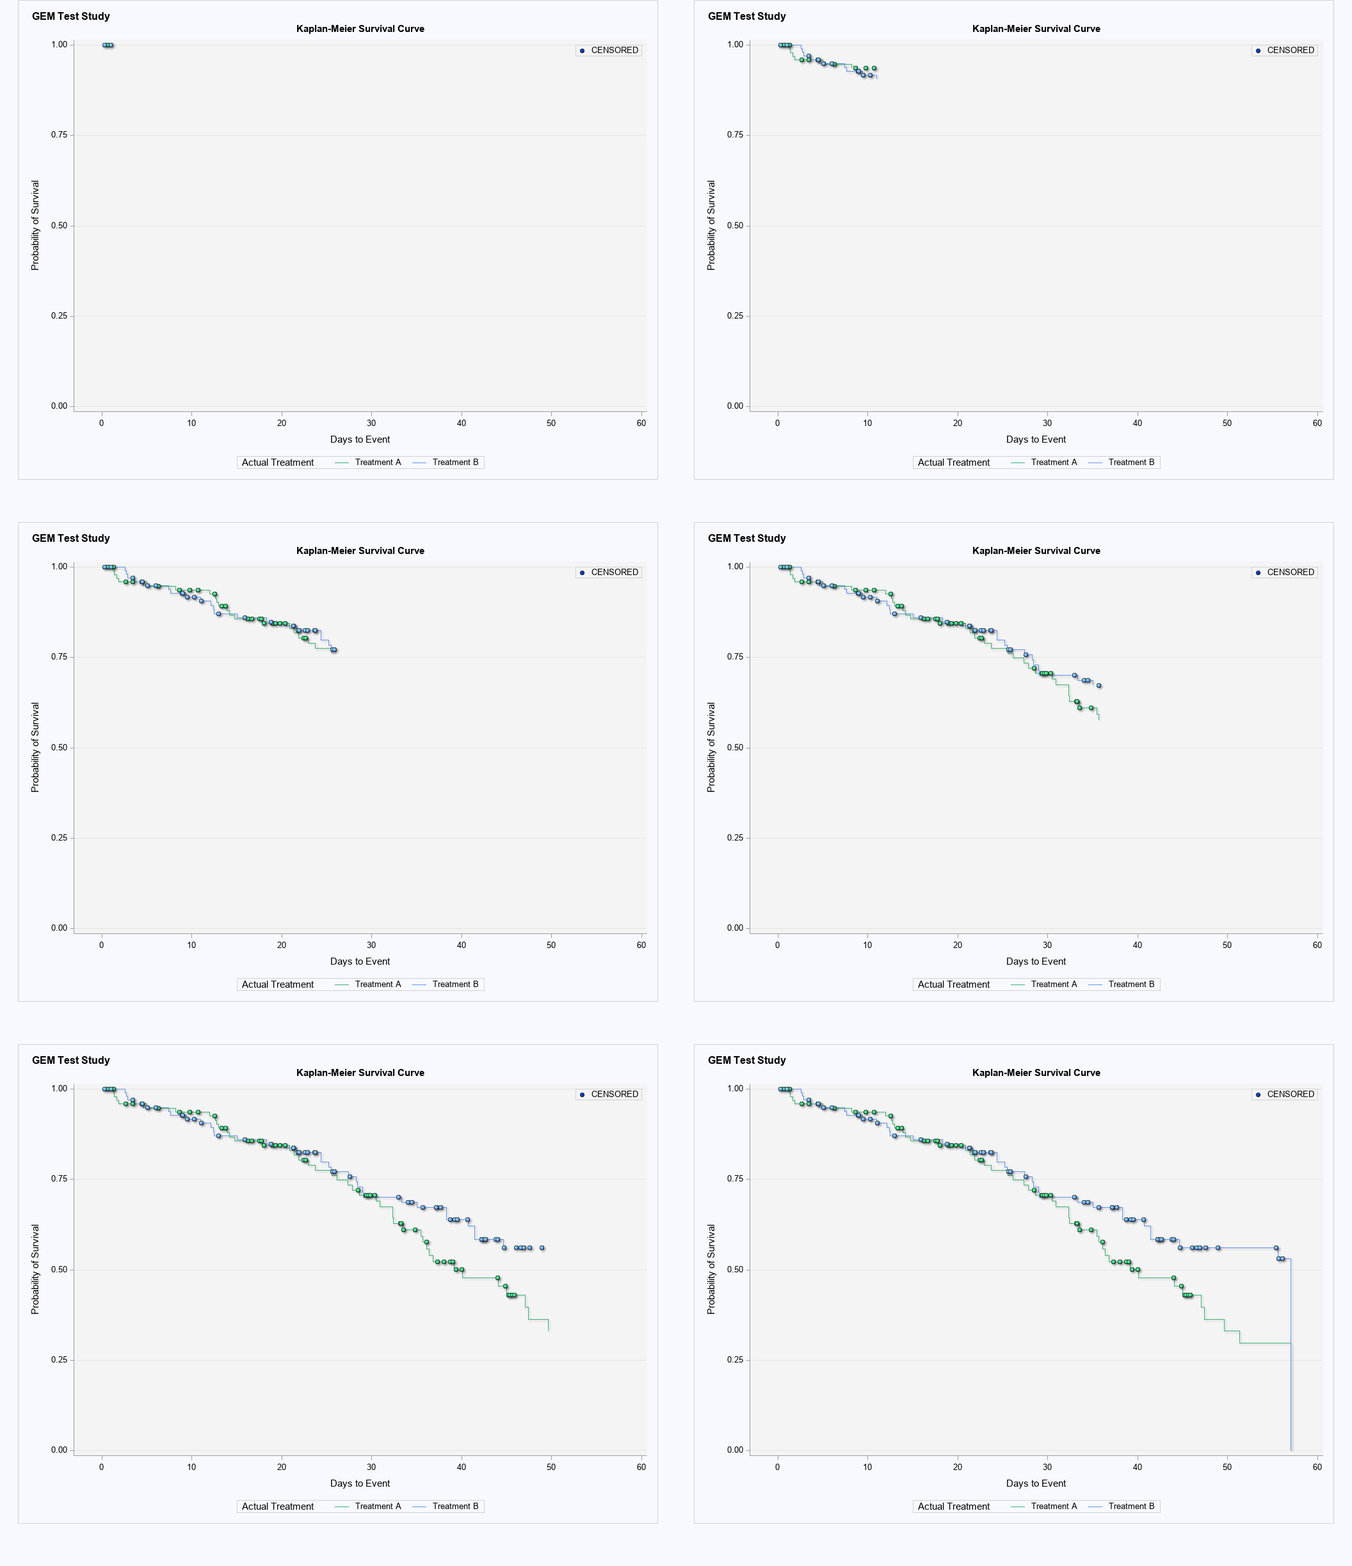
Survival Plot KM
View Animated Example
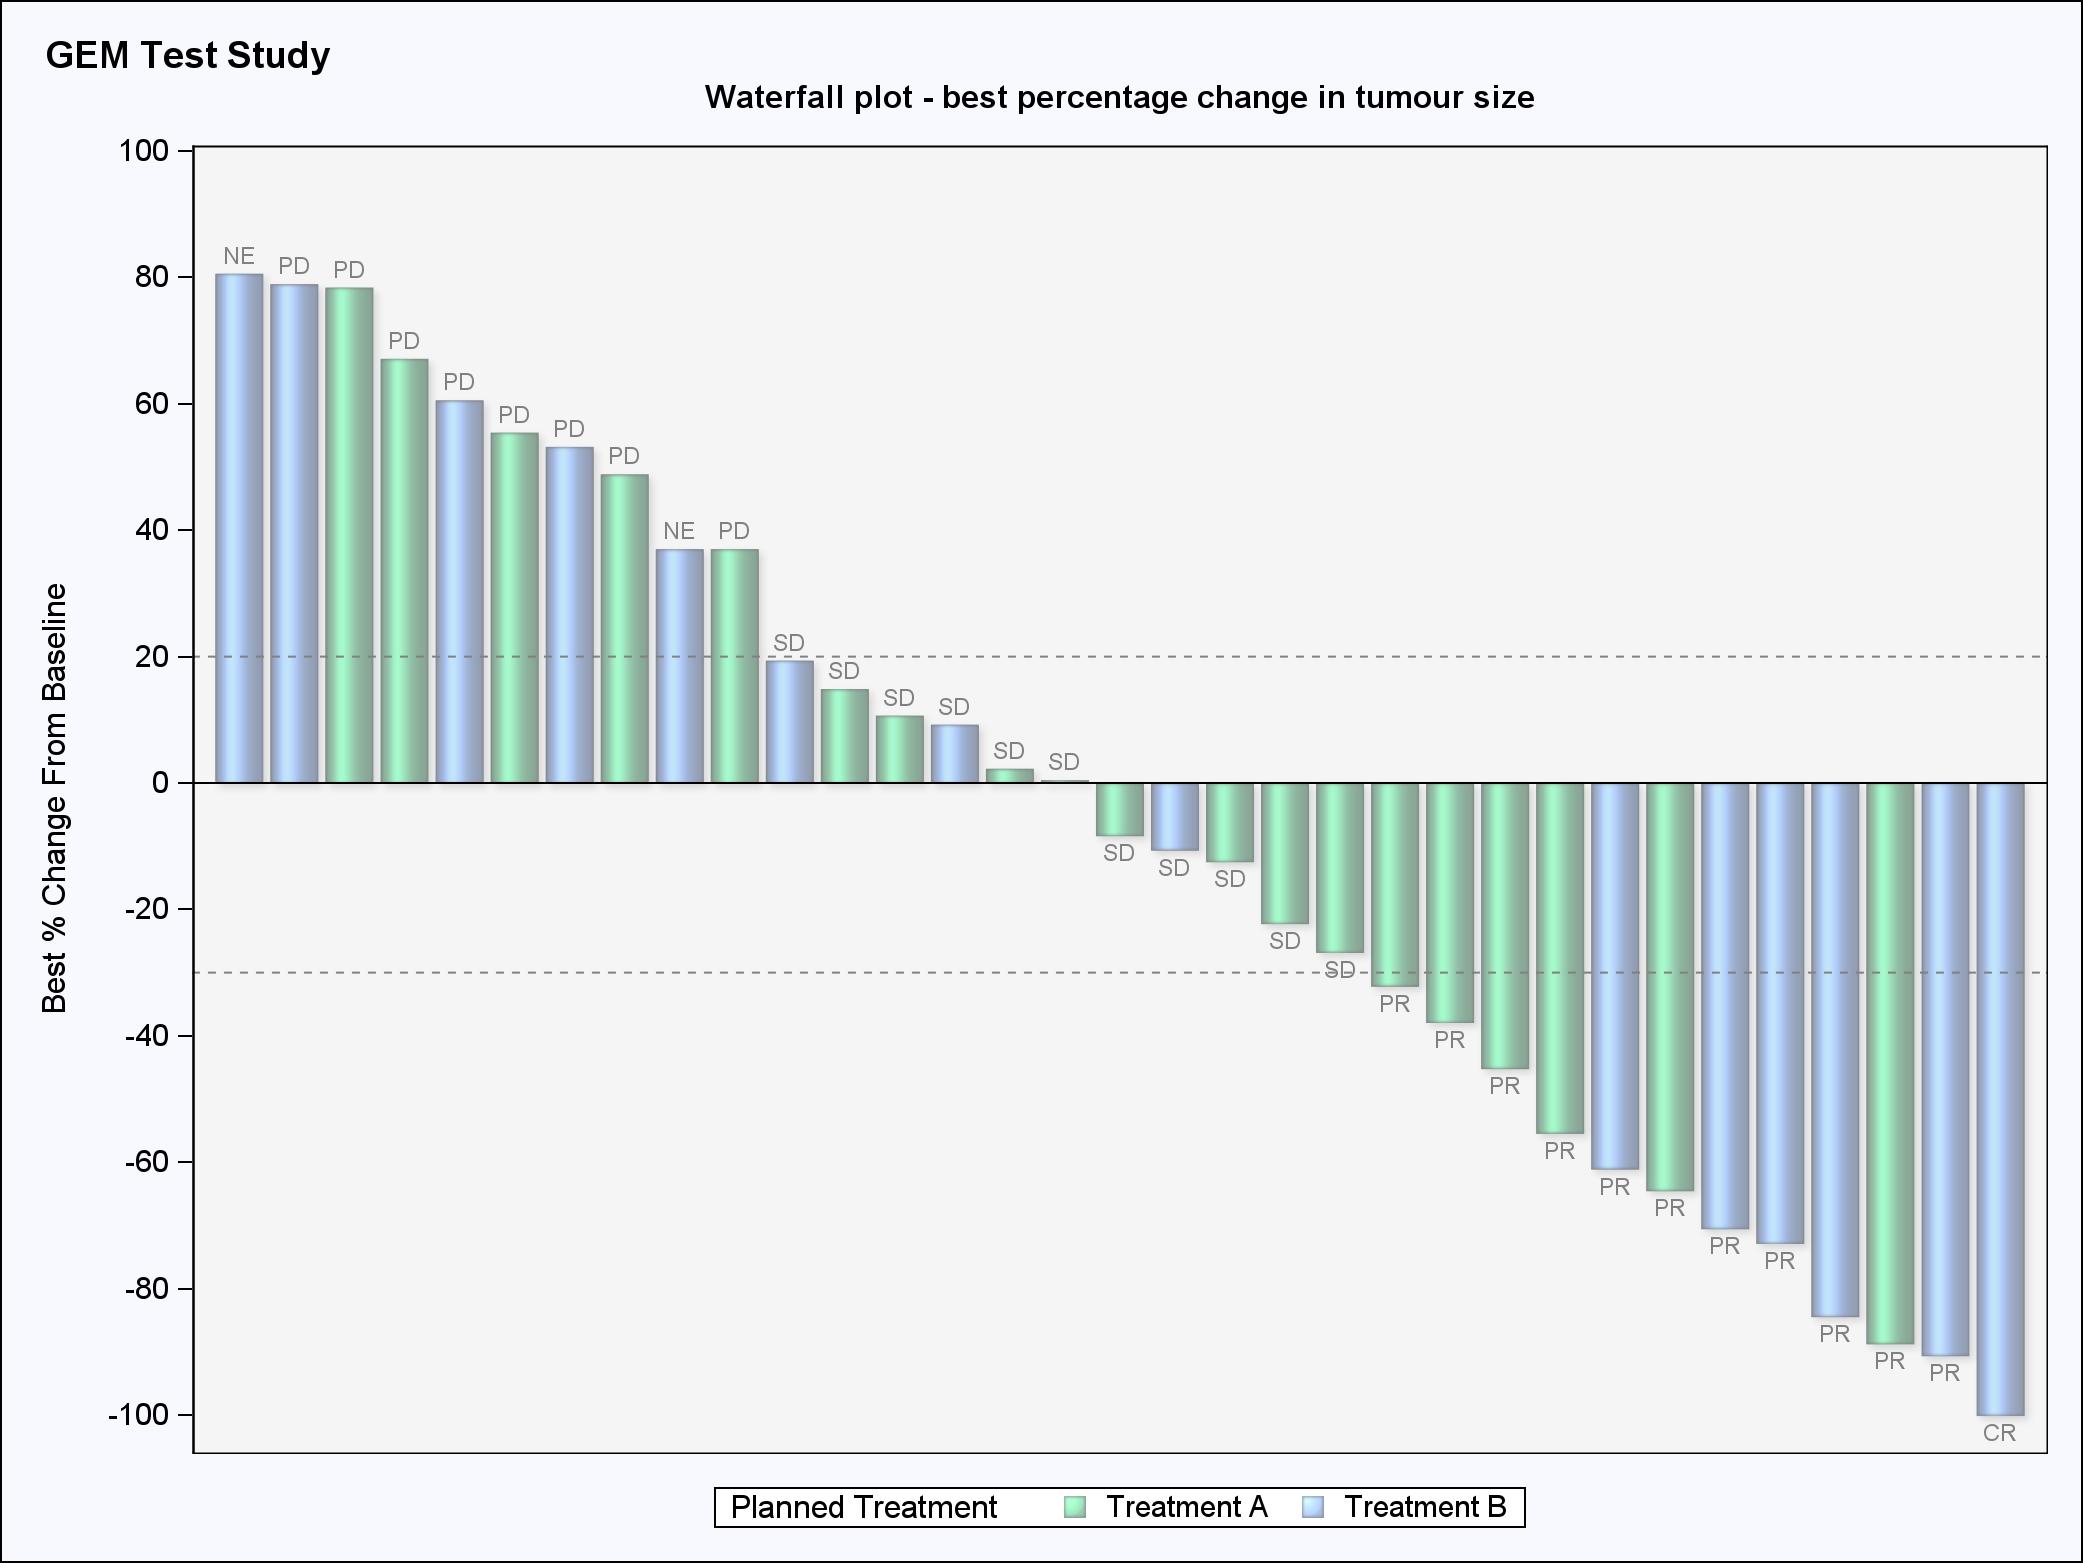
Waterfall Plot
View Example
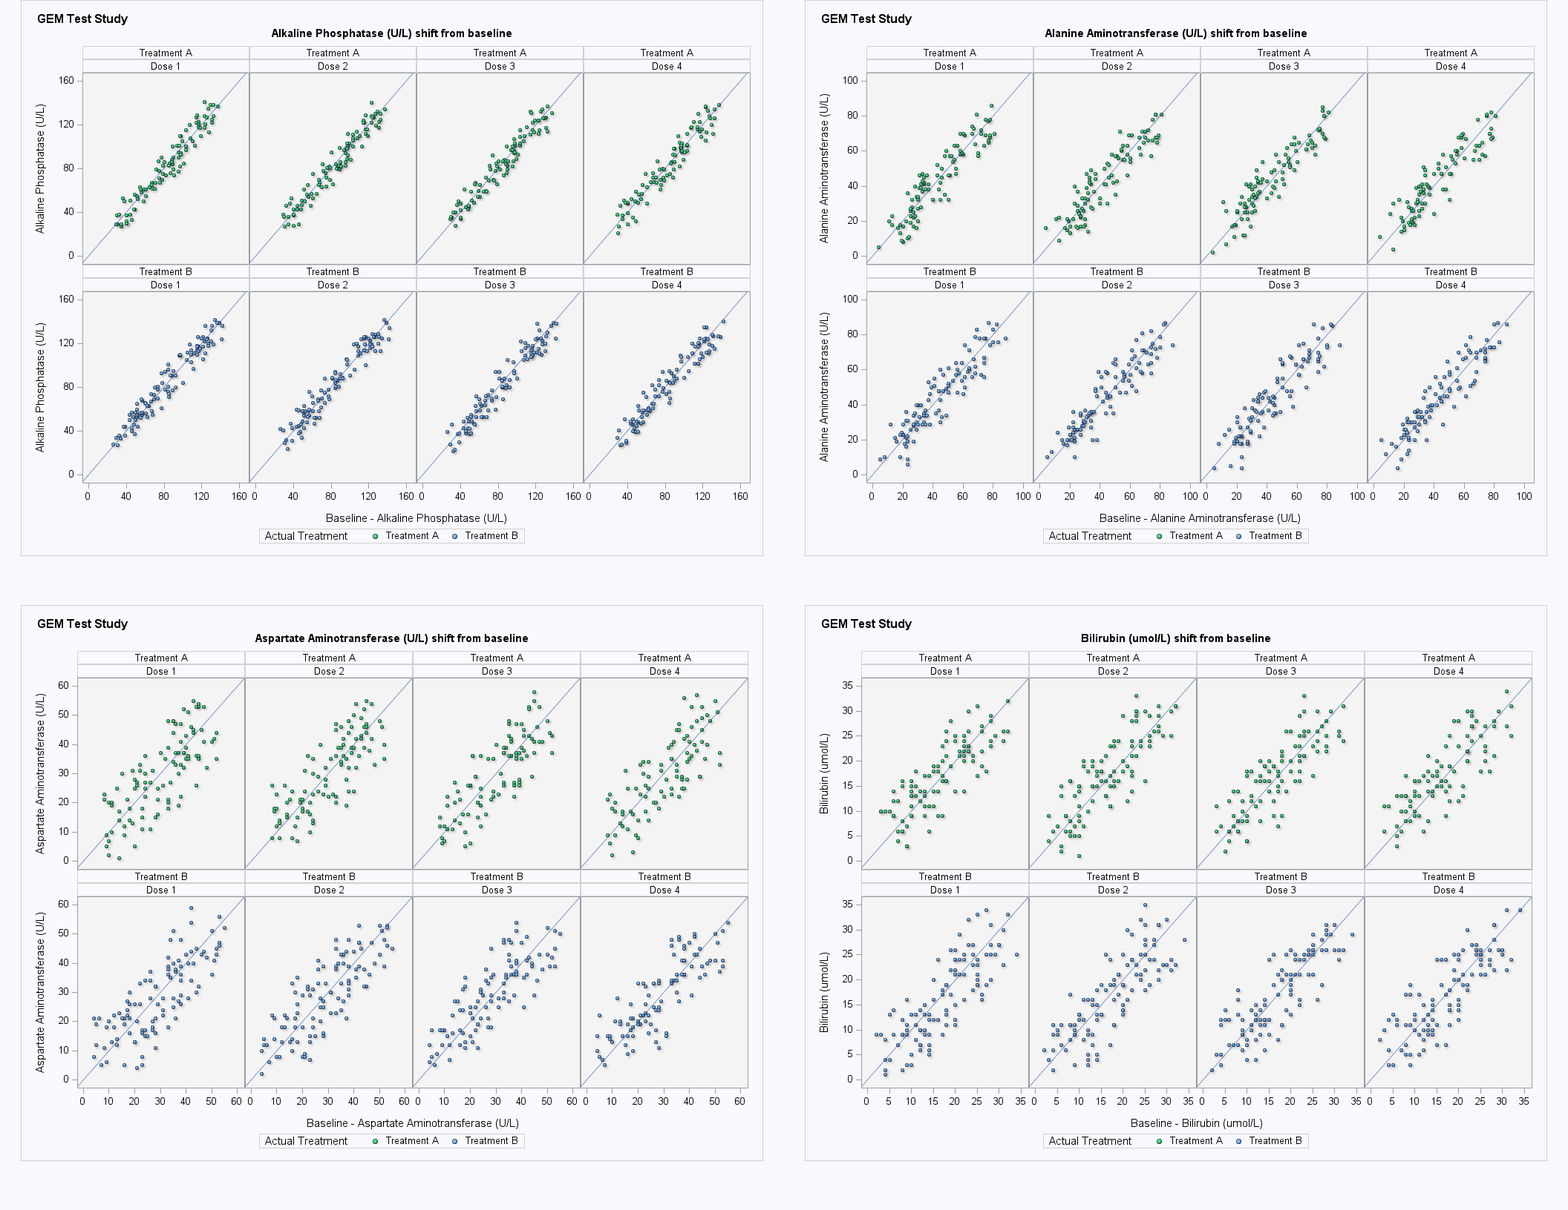
Baseline Shift Plot
View Example
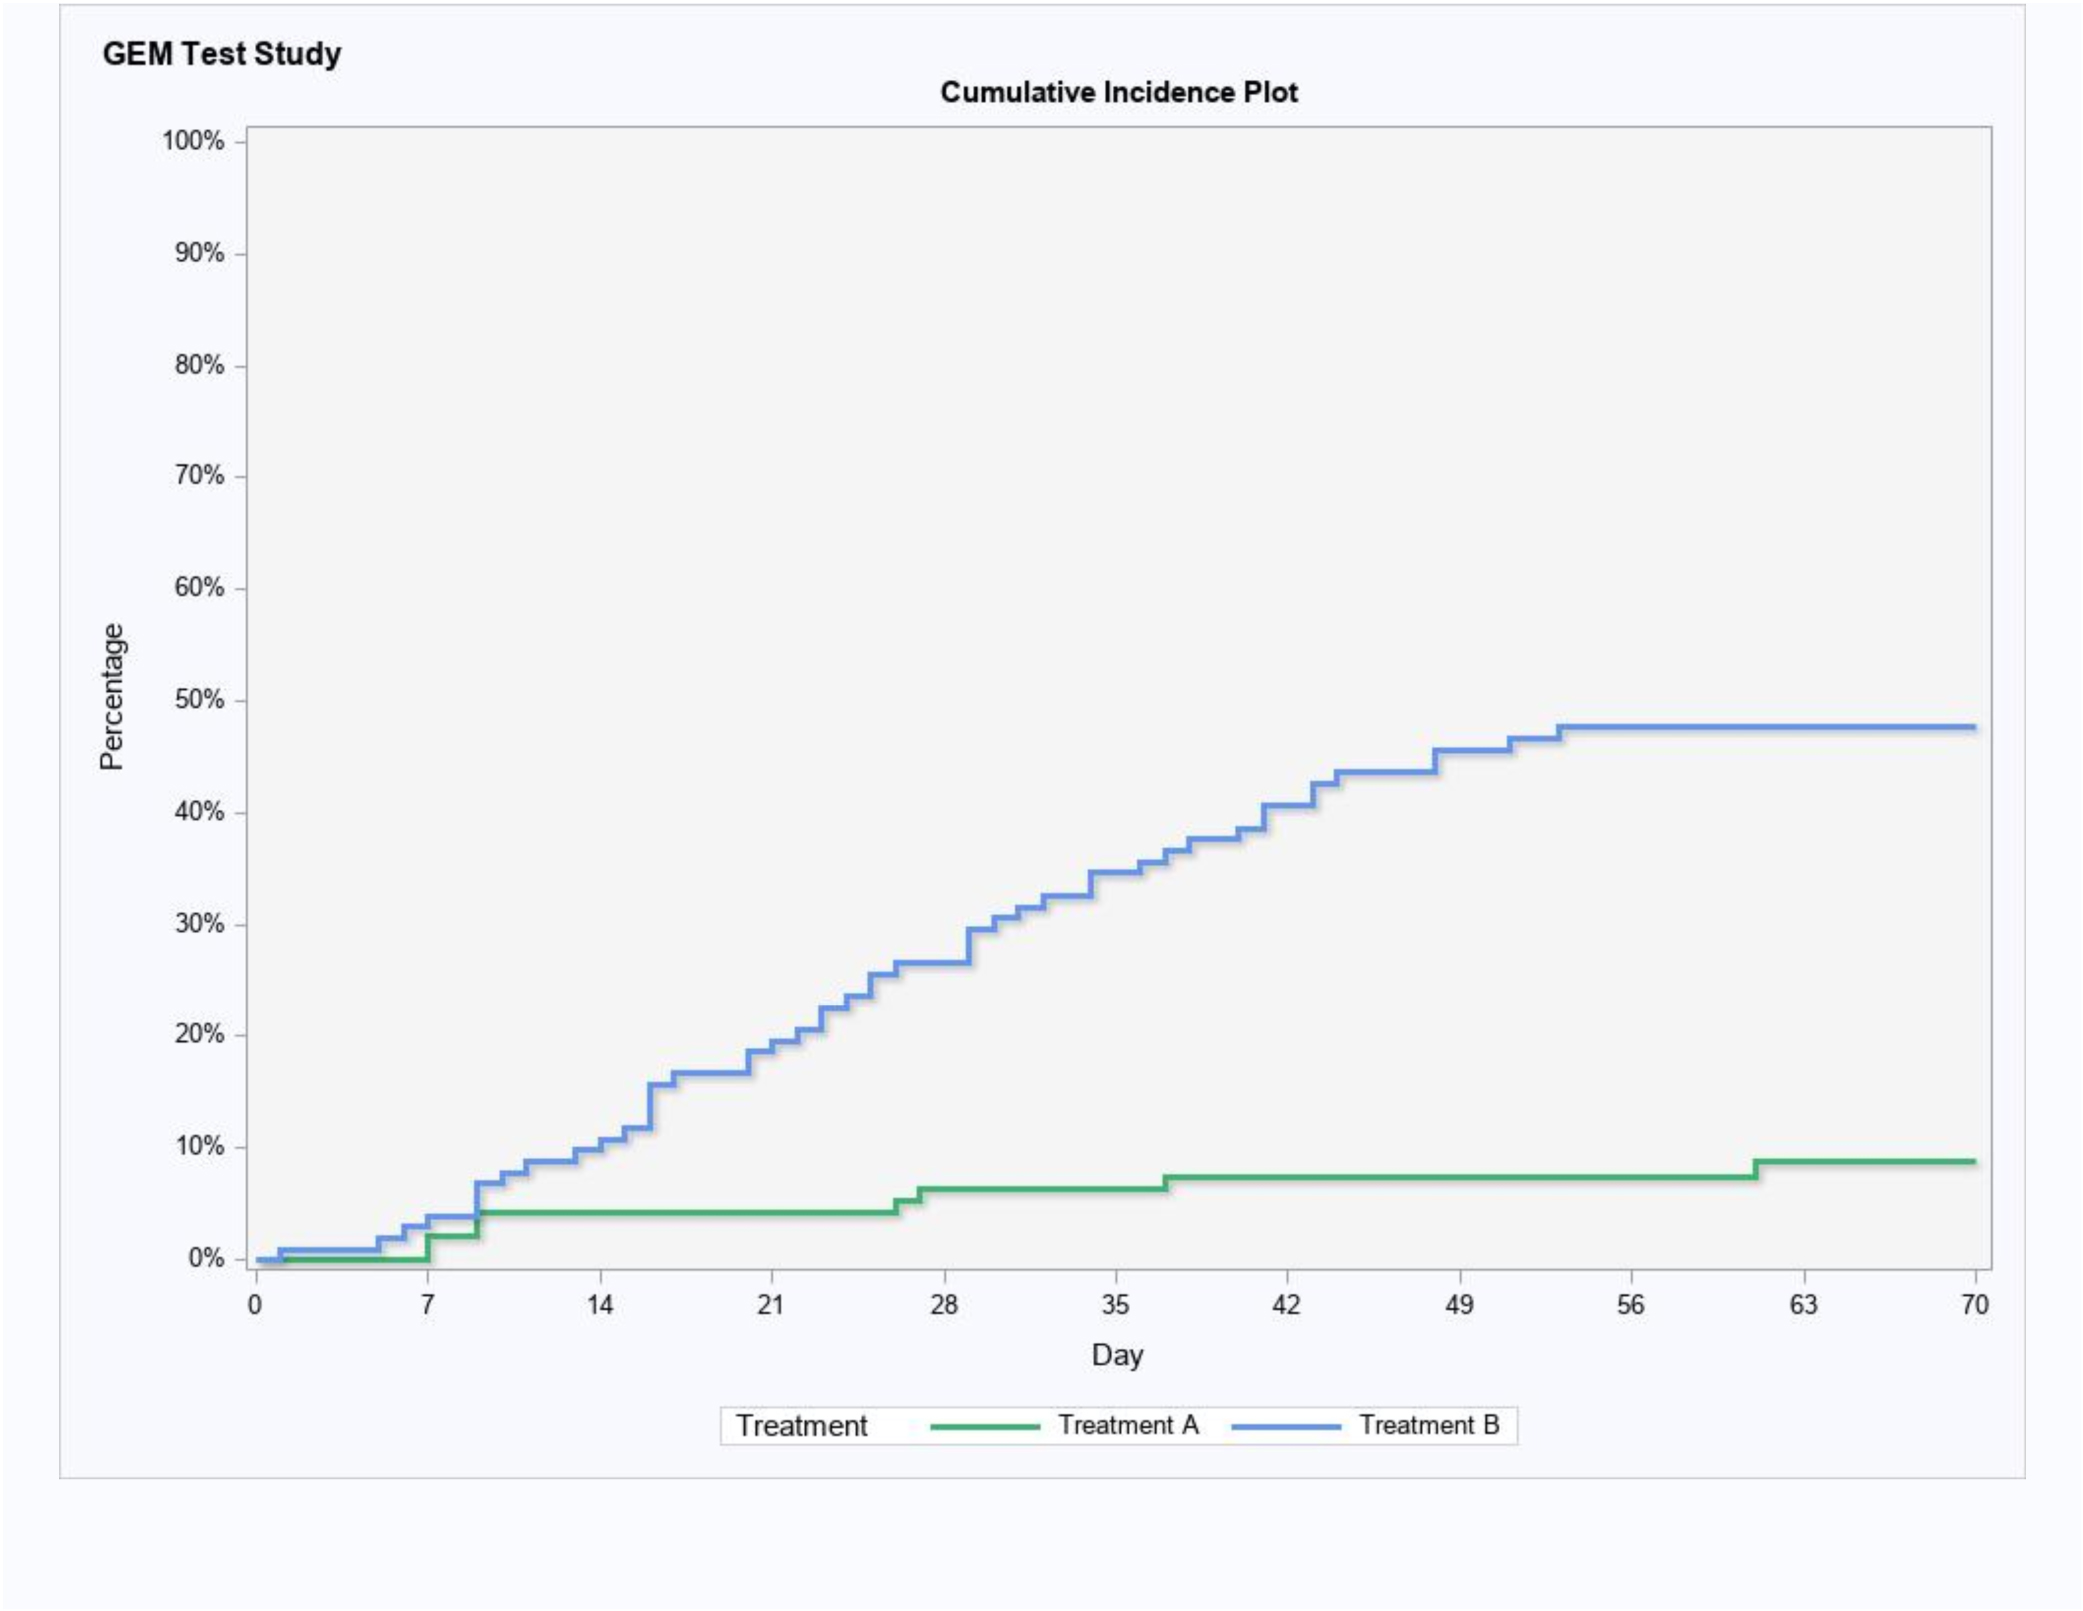
Cumulative Incidence Plot
View Example
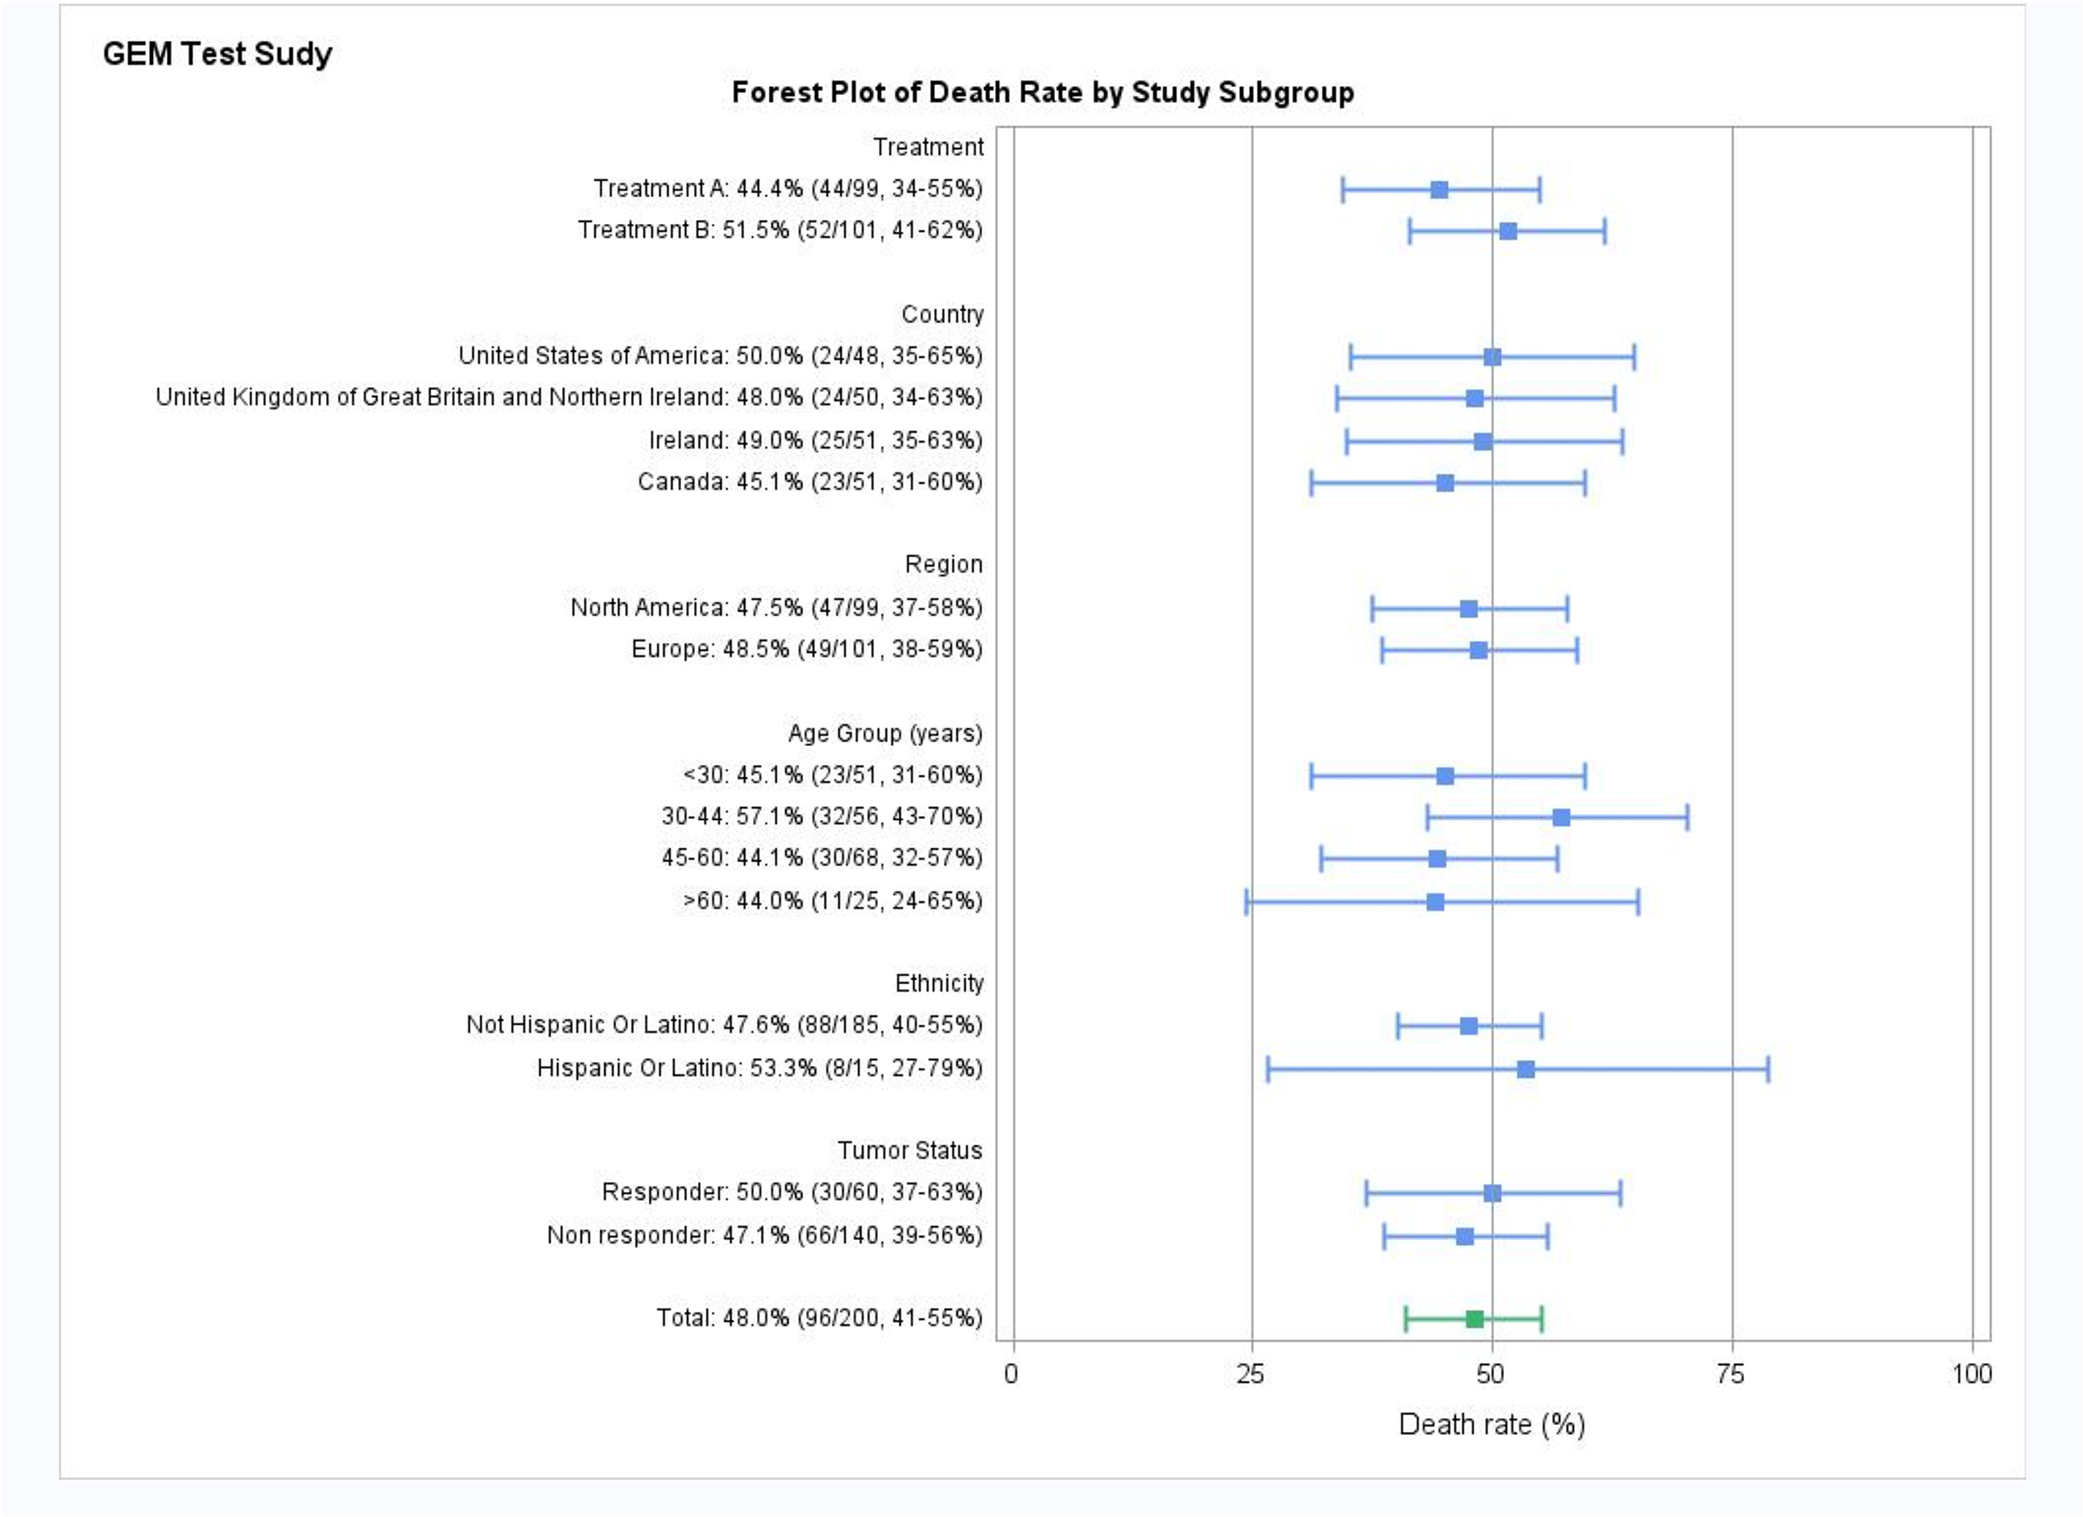
Forest Plot
View Example
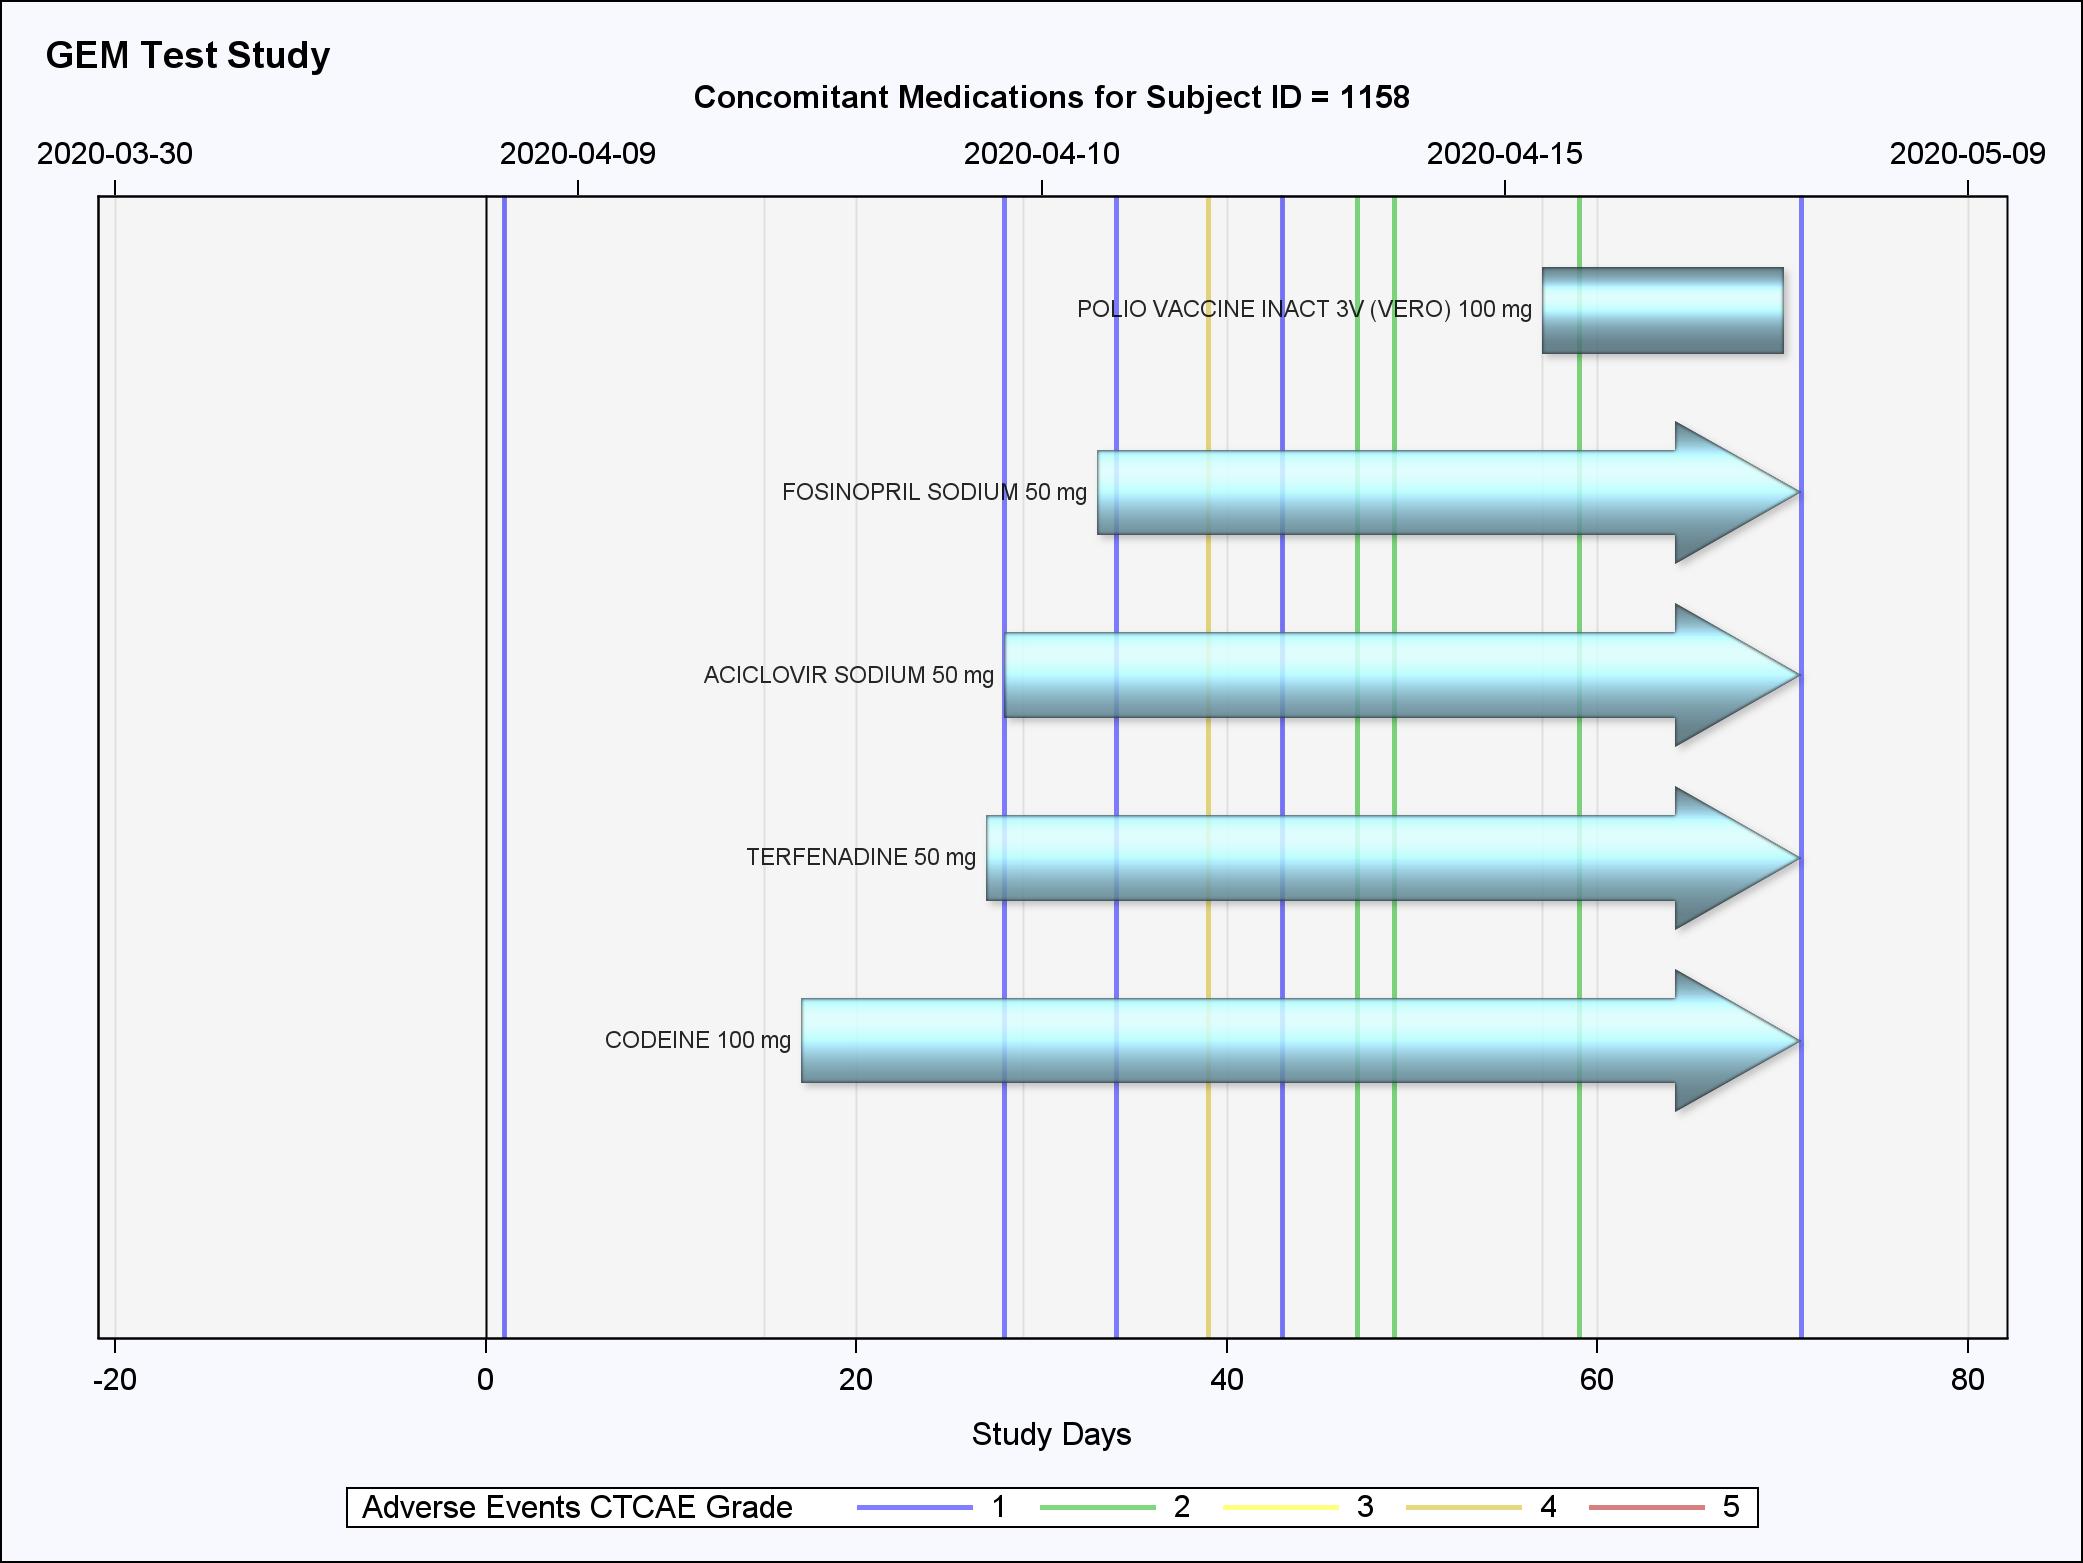
Patient Profile
View Example
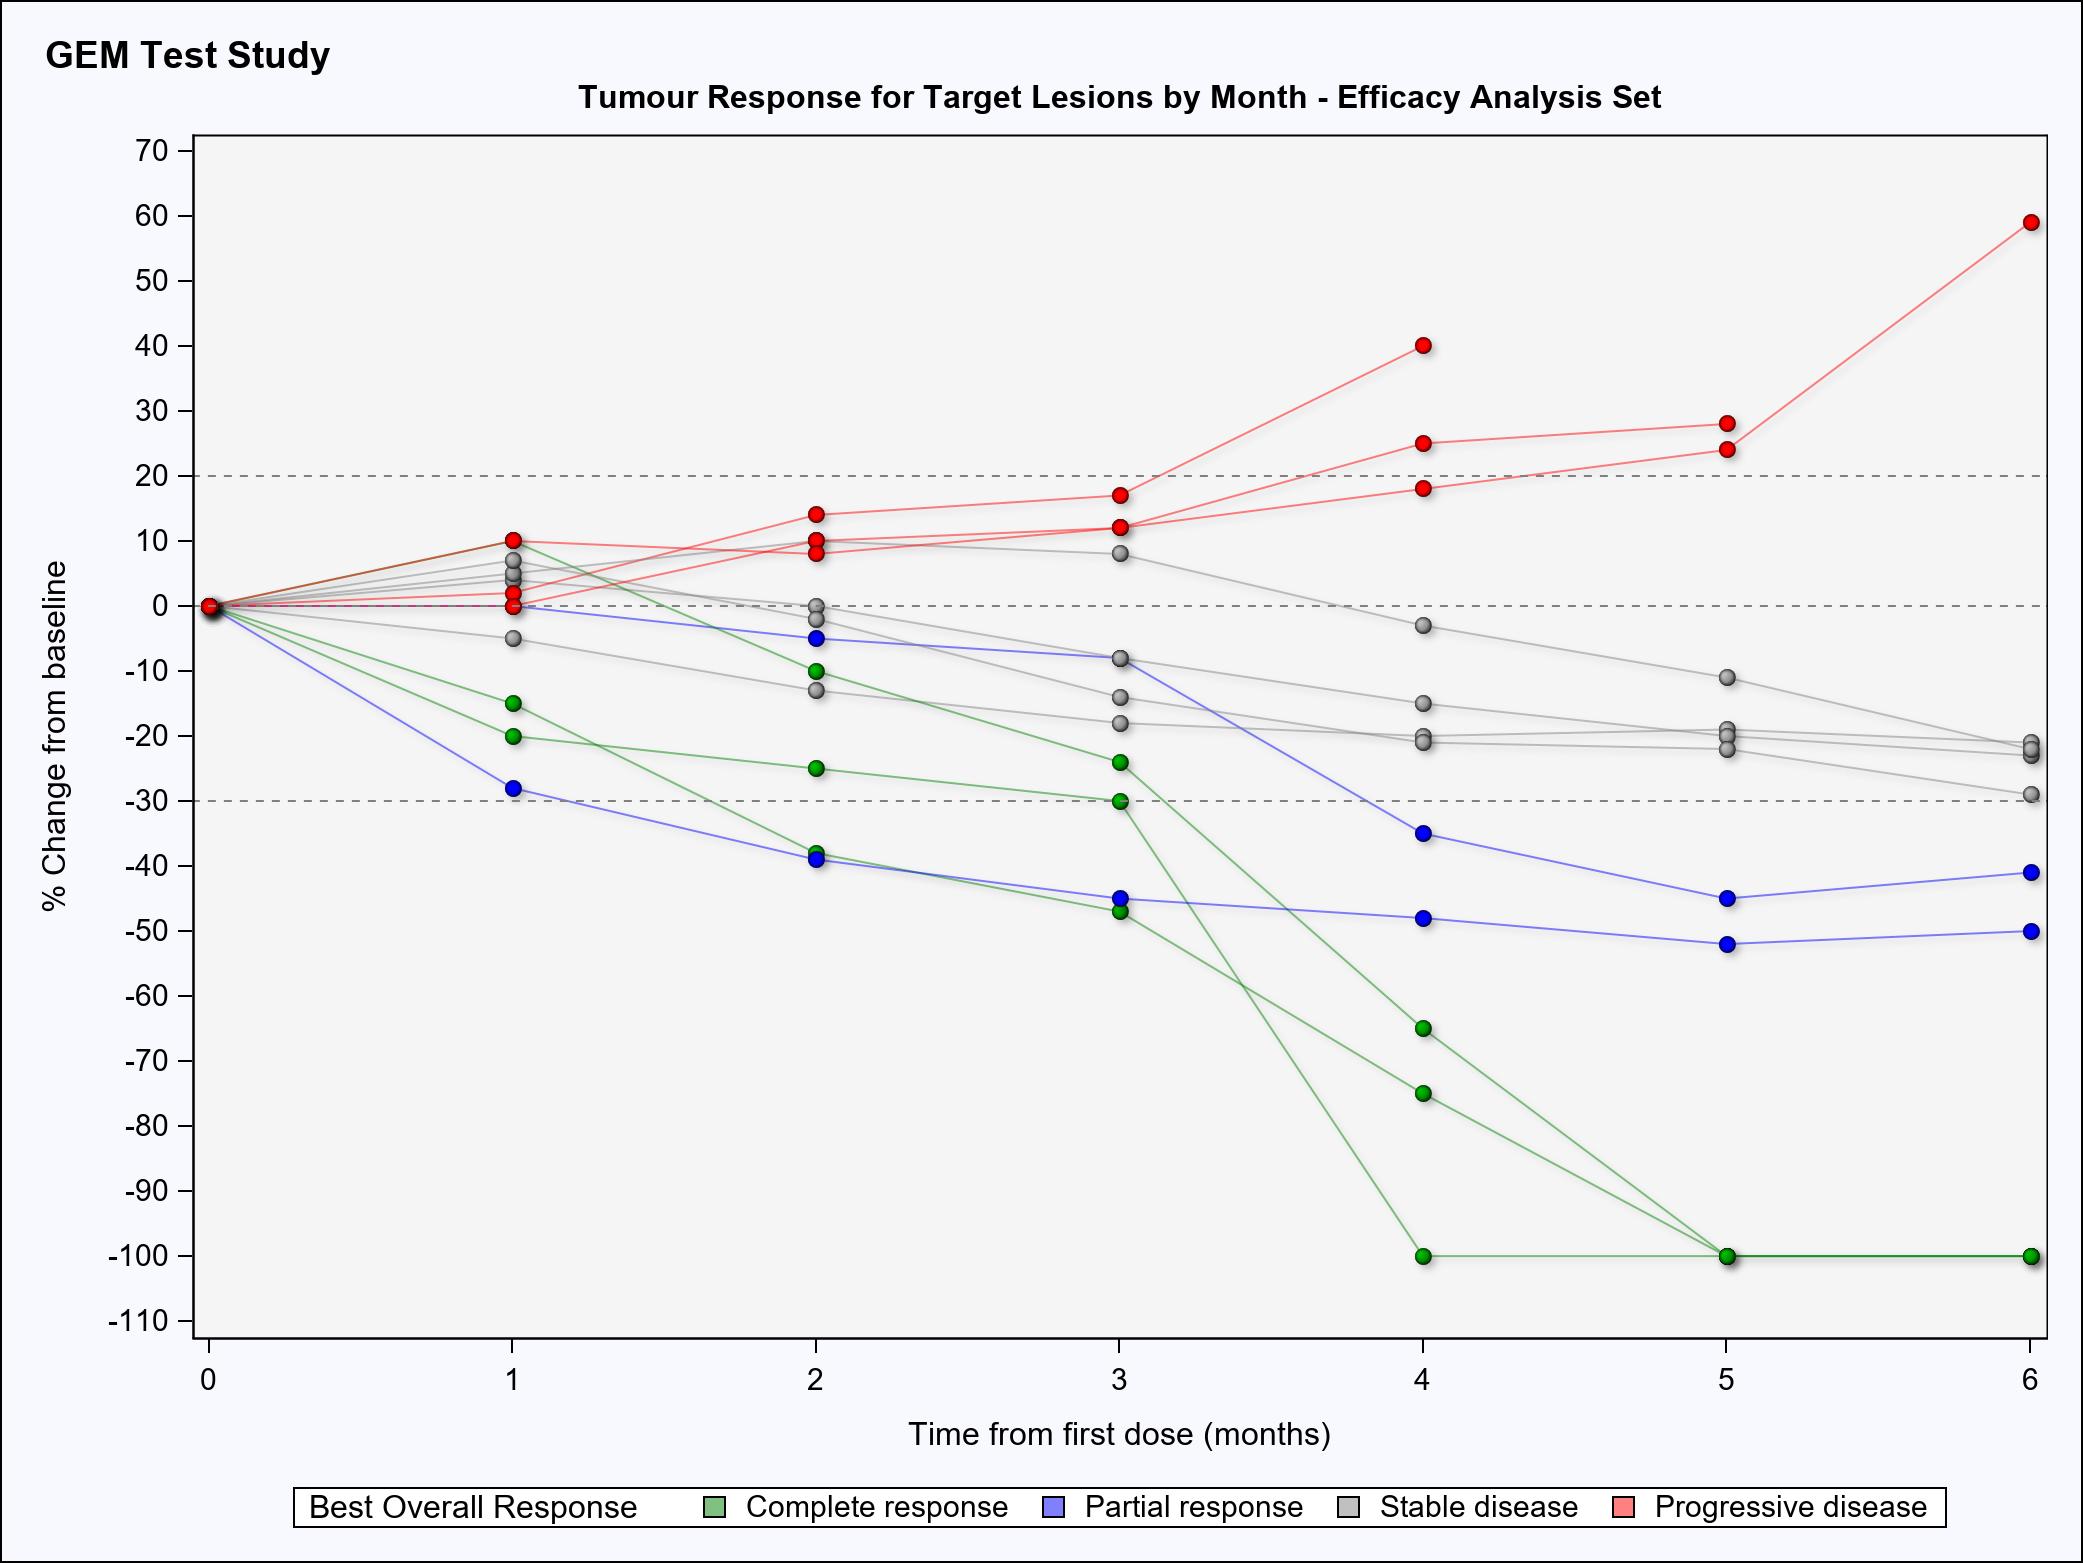
Spider Plot
View Example
Close
Close
Close
Close
Close
Close
Close
Close
Contact Us
If you are looking for expert statistical programming with a friendly and flexible approach, contact us today to learn more about our services.
