GEM Programming Solutions
R implementation. Case Studies
R Case Study 1
Reporting of a phase I study
Find out more
R Case Study 2
Subway plots for phase II study
Find out more
R Case Study 3
Independent QC for a device study
Find out more
Close Window
R Case Study 1 – Reporting of a phase I study
GEM have completed the reporting of a Phase I study end to end using R for the first time. This was a tremendously exciting milestone for us since it has demonstrated the skills and capabilities to deliver using our new open-source toolset. As this was the first study to report, we encountered a number of challenges that we were able to develop solutions for which can be used in the reporting of future studies.
Close Window
R Case Study 2 – Subway plots for phase II study
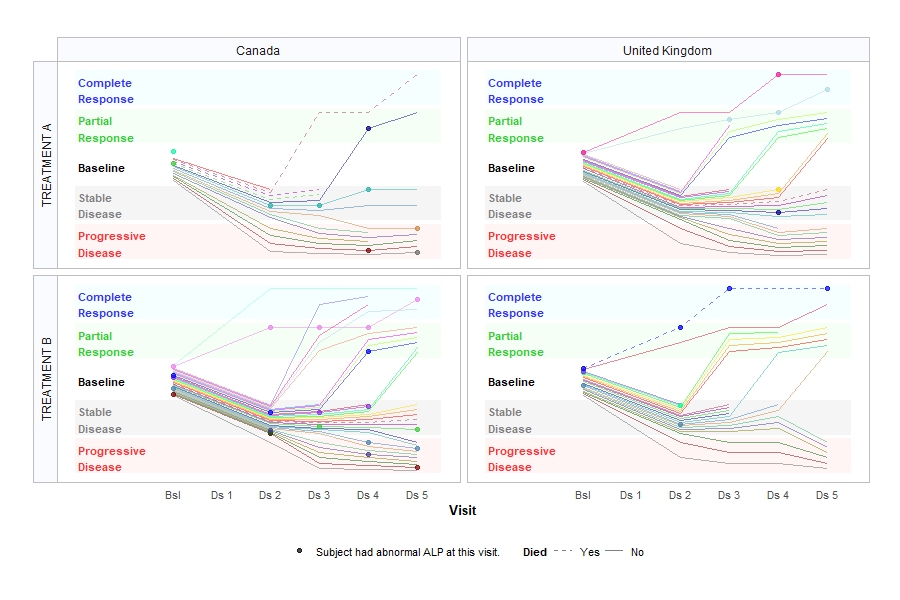
A client was producing plots for an infection phase II study using Excel. They asked us whether it was possible to recreate the subway and swimmer plots in a reproducible and traceable manner using code. This was the perfect opportunity to take advantage of one of the strengths in R – customisation of plots. By using R (specifically the package {ggplot2}), we were able to produce these plots to look exactly as the client was accustomed to, whilst keeping it flexible enough to include additional edits as required.
See Subway plot examples below (based on GEM test data)

Close Window
R Case Study 3 – Independent QC for a device study
During 2022, we completed a project where we were asked to provide Reporting datasets and Tables, Figures and Listings for a medical device study. This was a key achievement as we had produced the independent QC programming using R. Implementing two different languages for the primary and QC meant that the same results were reached using completely different methods. An extra level of assurance for the sponsor and an indication of our own internal capabilities.
The datasets were created using the {tidyverse} collection of packages, along with the pharmaceutical industry-specific package {admiral} – a package to assist in the creation of ADaM datasets. The safety tables were produced using another industry-specific package {Tplyr}.
If you are looking for expert statistical programming with a friendly and flexible approach, contact us today to learn more about our services.
